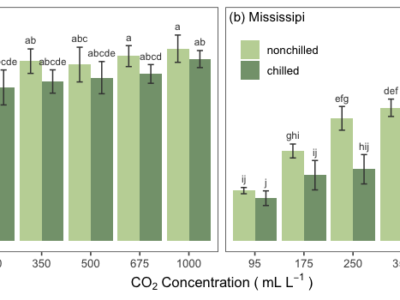
Barplots for the Results of a Three-Factor Experiment
This tutorial presents some suggestions on how to organize and show results of a three factor experiment using a barplot
Two-Way ANOVA in R – Step-by-Step Tutorial
Two-Way ANOVA in R – Step-by-Step Tutorial ANOVA, Tukey’s test, summarised table, compact letter display, barplot, scatterplot Rosane Rech Loading the appropriate... Read More