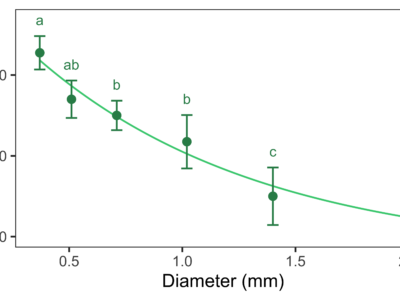
Step-by-Step Scatterplot for One Factor in R
In this tutorial, we are going to build scatter plots with error bars (standard deviation) and letters indicating significant differences among means.
M | T | W | T | F | S | S |
---|---|---|---|---|---|---|
1 | 2 | |||||
3 | 4 | 5 | 6 | 7 | 8 | 9 |
10 | 11 | 12 | 13 | 14 | 15 | 16 |
17 | 18 | 19 | 20 | 21 | 22 | 23 |
24 | 25 | 26 | 27 | 28 | 29 | 30 |
31 |