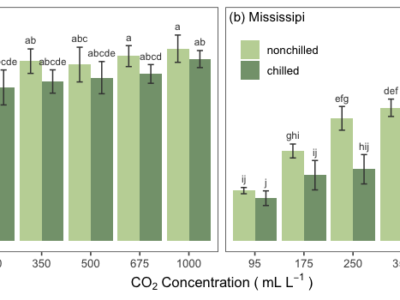
Barplots for the Results of a Three-Factor Experiment
This tutorial presents some suggestions on how to organize and show results of a three factor experiment using a barplot

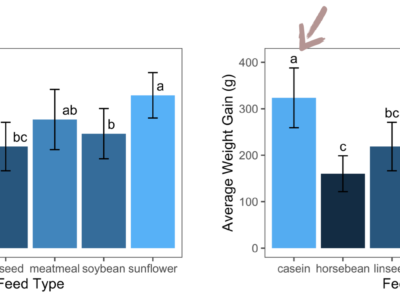
Barplot for Two Factors in R – Step-by-Step Tutorial
Publication-quality bar plots for two factors with error bars and letters indicating significant differences among means.
Two-Way ANOVA in R – Step-by-Step Tutorial
Two-Way ANOVA in R – Step-by-Step Tutorial ANOVA, Tukey’s test, summarised table, compact letter display, barplot, scatterplot Rosane Rech Loading the appropriate... Read More
Customising the Compact Letter Display Position
Customising the Compact Letter Display Position Compact Letter Display, Barplot Rosane Rech Data analysis and table with the with the mean, the... Read More
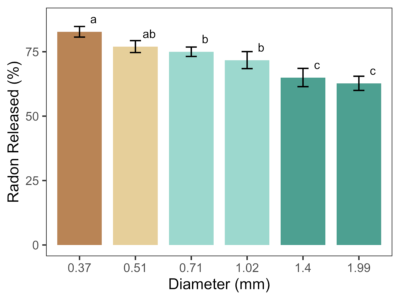
Step-by-Step Barplots for One Factor in R
Step-by-Step Barplots for One Factor in R ggplot, error bars, compact letter display, Tukey’s test Rosane Rech Basic barplot Adding error bars... Read More
One-Way ANOVA Step-by-Step – R tutorial
ANOVA, Tukey’s test, sumarised table, compact letter display Table of Contents: Loading the appropriate libraries Loading and checking the data Creating a... Read More