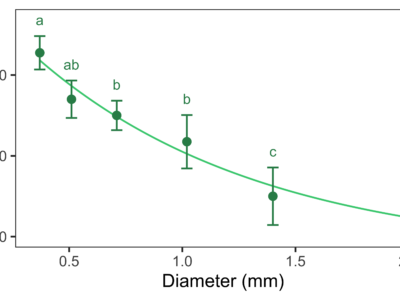
Step-by-Step Scatterplot for One Factor in R
In this tutorial, we are going to build scatter plots with error bars (standard deviation) and letters indicating significant differences among means.
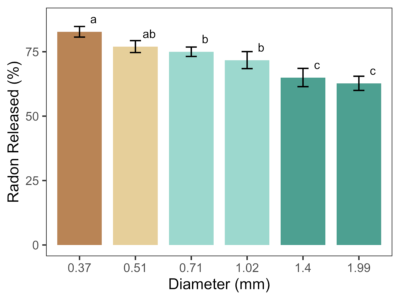
Step-by-Step Barplots for One Factor in R
Step-by-Step Barplots for One Factor in R ggplot, error bars, compact letter display, Tukey’s test Rosane Rech Basic barplot Adding error bars... Read More
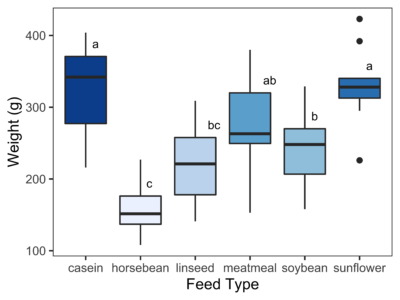
One-Way ANOVA and Box Plot in R
One-Way ANOVA and Boxplot in R ANOVA, ggplot, compact letter display, Tukey’s test Loading and checking the data Analysis of variance for... Read More